To deliver on time is the upmost target for a manufacturer. Independent Requirement Planning (VSF) and Dependent Requirements have a strong impact on this. Since many materials being produced and demand is driven from several SAP items like VSF, Sales Orders and Scheduling Lines the analysis of demand fluctuations is most important. This chapter Call-Off Analysis shows several options to do so.
1. Scheduling Agreements – VA33
The classical option is the button „Analysis“
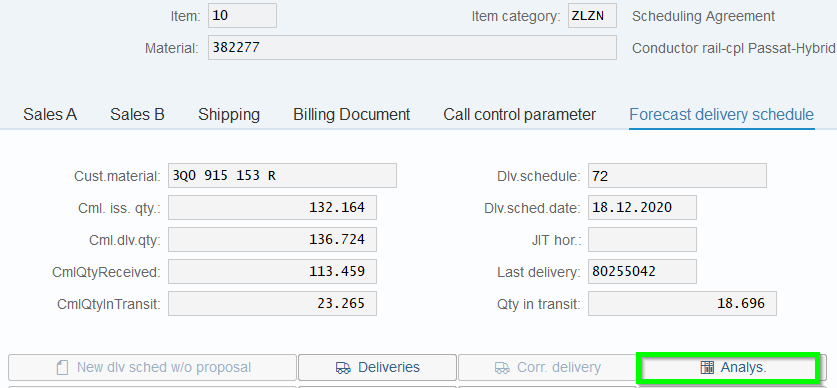
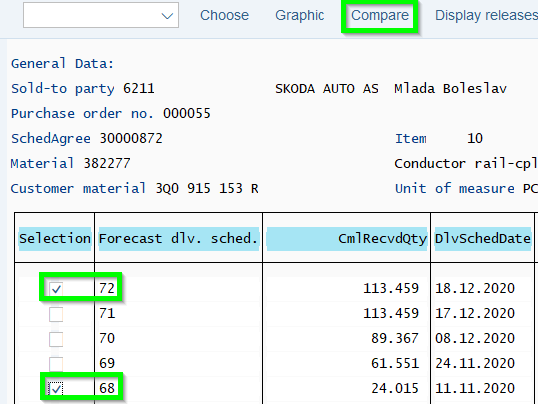
Here all call-offs being displayed and comparisons can be made. In our example call-off No. 72 with 68:
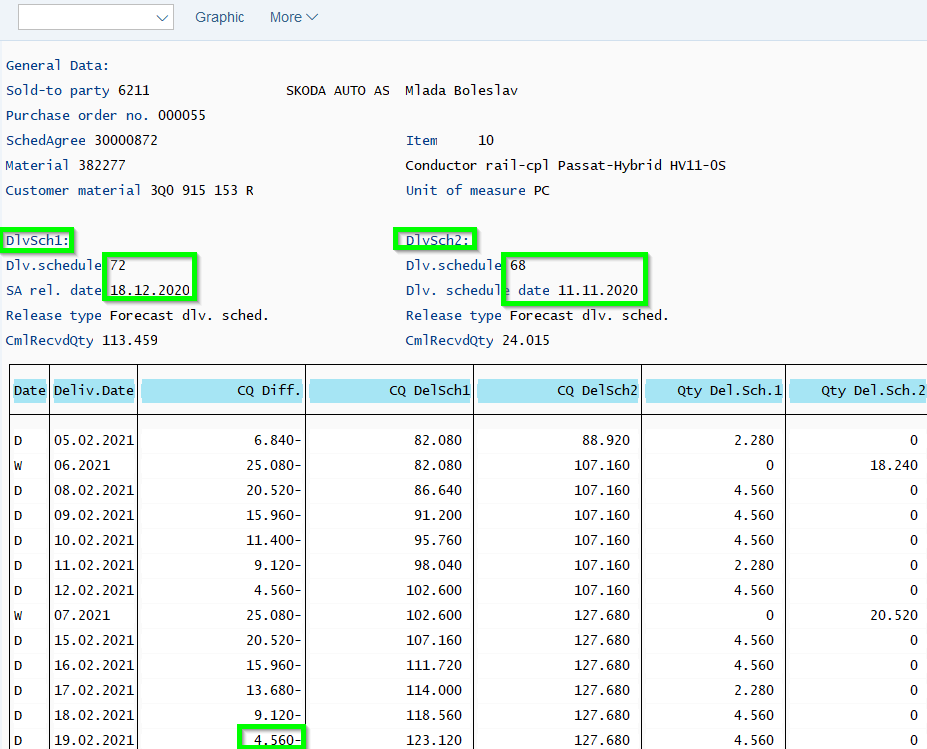
The demand dropped by -4.560 pcs. by 19.02.2021:
The Graphic option can be used as well:
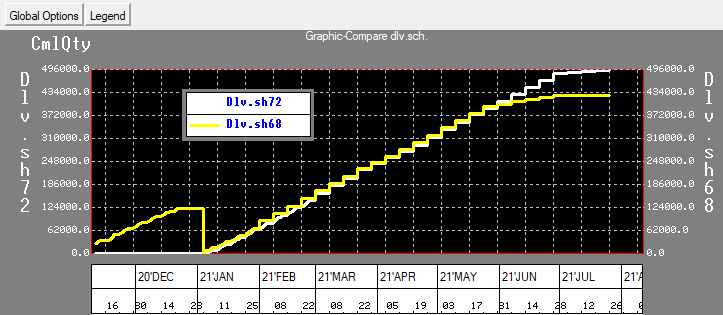
This method is normally used when specific analysis being made. But when you have several scheduling lines for one material the total picture cannot be retrieved. Especially OEM’s with different production sites create several scheduling lines. So how will you know if one scheduling line was increased and the other decreased so maybe totally no major demand fluctuation?
Other software tools like Business Intelligence (BI) are better options. In the following a half-automated method being explained:
2. Half-automated Query – Excel analysis
A) Create Queries
In the chapter Query you can train yourself how to create queries. The approach is to create Excel files out of SAP in the logic how SAP calculates. The logic is as follows:
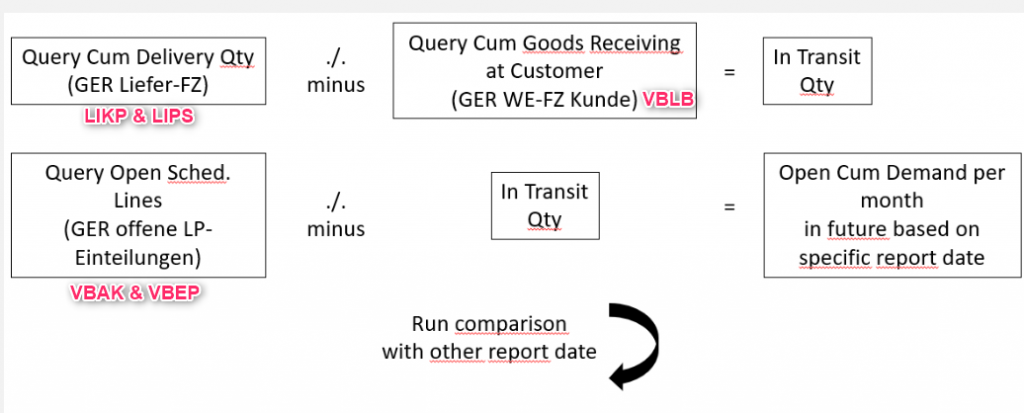
——————————————————————————————————————–
- InfoSet Table Open SD Scheduling Lines. (GER Offene SD-Einteilungen) (SQ02)
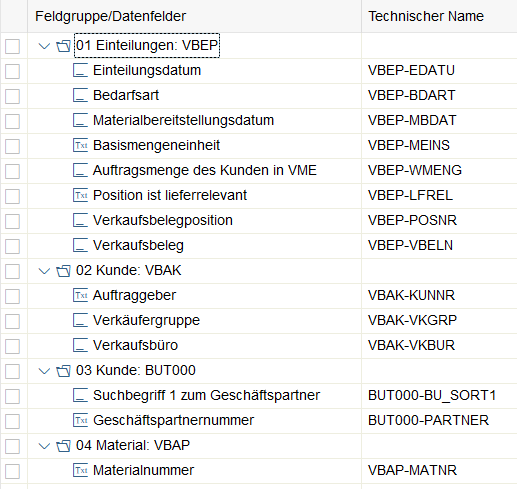
- Query Selection Open SD Scheduling Lines. (GER Offene SD-Einteilungen) (SQ01)
- Query Basic List
- Query Selection Open SD Scheduling Lines. (GER Offene SD-Einteilungen) (SQ01)
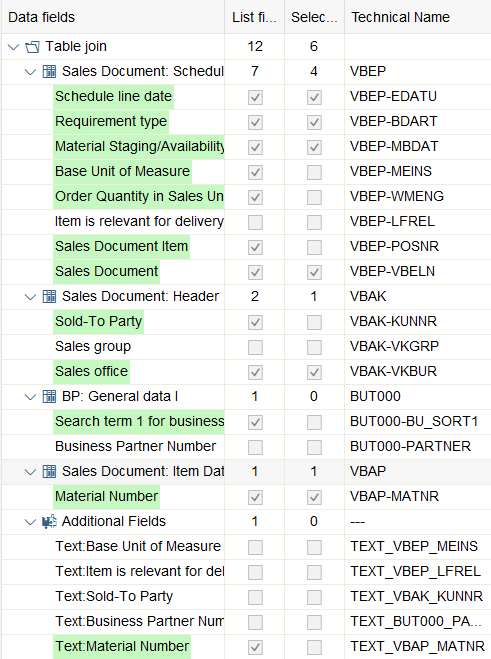
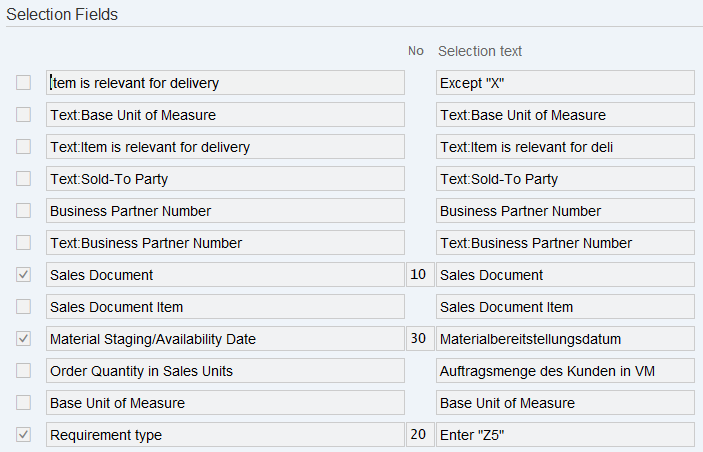
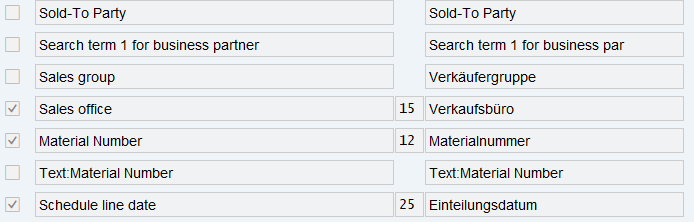
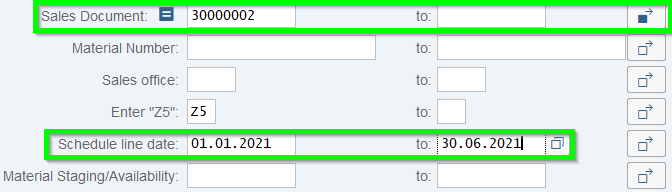
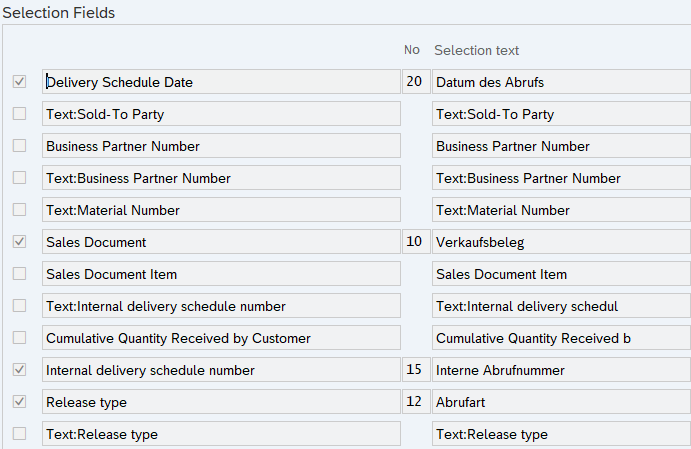
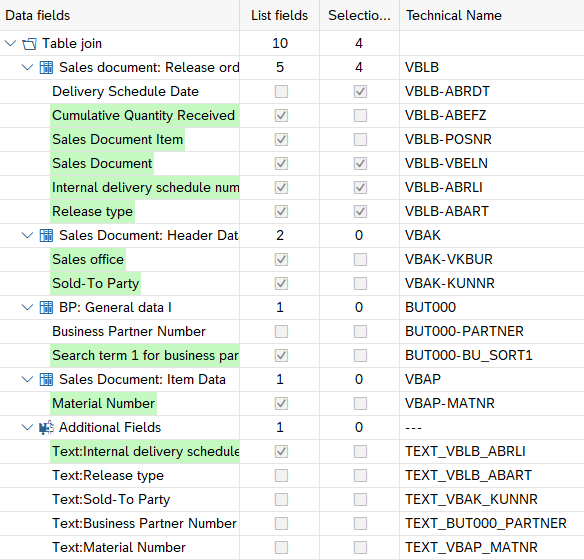
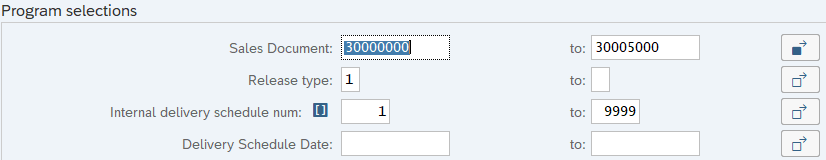
- Run Query with following setting (SQ00). Before an analysis should be made to detect relevant SD-Scheduling Agreements. It is recommended that a variant being created which excludes the not relevant Sales Documents (see first green marked area below). Since we like to compare a certain period in the future the scheduling line date should be started from 01.01.2021 up to 30.06.2021 or longer (see second green marked area below):
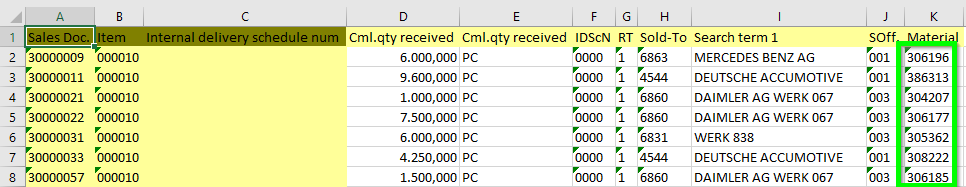
- The Excel result looks like:
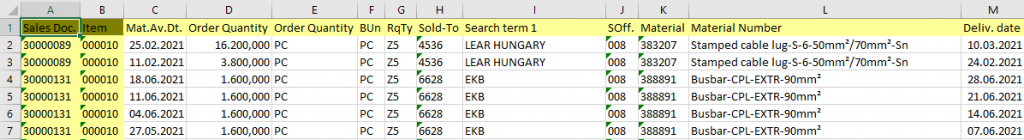
- It is recommend to change the format type of column „Material“ to Standard to run VLOOK Excel transaction later.
——————————————————————————————————————–
- To create the total cum. figure the current Goods Receiving cum figure needs to be added. Following 2nd query being installed. InfoSet Table Goods Receiving Cum. Fiq. (SQ02)
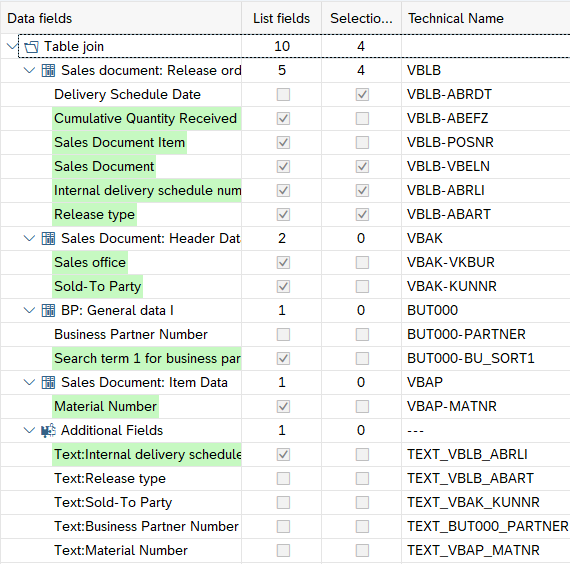
- Query Selection Goods Receiving Cum. Fiq. (SQ01)
- Query Basic List Goods Receiving Cum. Fiq. (SQ01)
- Run Query with following setting (SQ00):
- Following result as Excel is created. The current cum. Goods Receiving fig. per scheduling agreement being displayed in column D. Change the Format of column „Material“ to standard for later VLOOK transaction:
——————————————————————————————————————–
B) Excel Analysis
- Now the files being transferred in following Excel-Pivot solution:
- The weekly downloads being stored in the sheet „Master Data“ (GER „Stammdaten“). Together with two other master data sheets „BF“ = Plan volumes and „Projects“ a VLOOK will add relevant data:

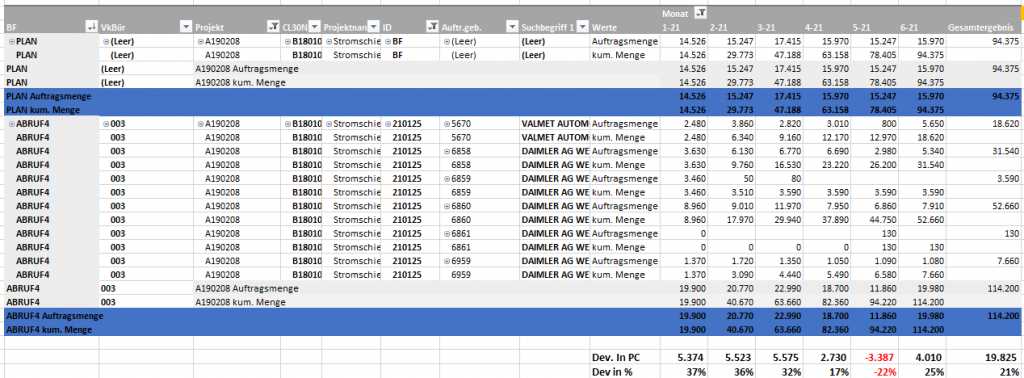
- The sheet „Pivot Project“ shows the comparison on project level (sum of all demands per project assigned materials. In the example the average call-off is 21% higher than the planned sales data BF:
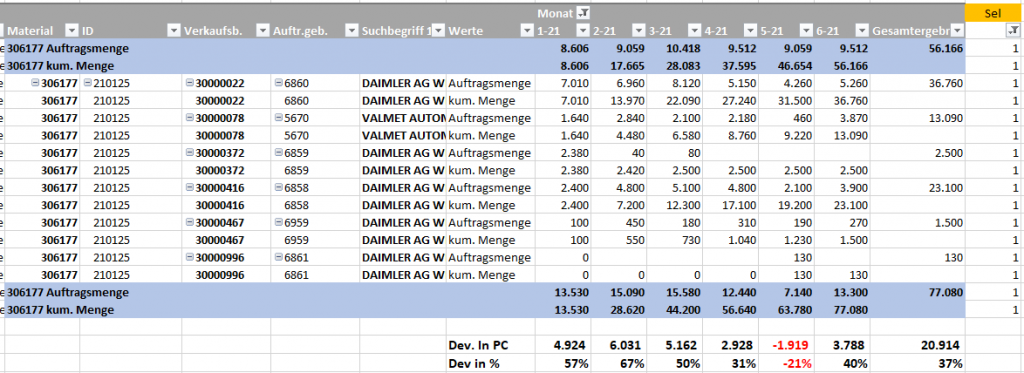
- The sheet „Pivot Material“ offers the option to break down the result on material number level:
Conclusion:
The SAP standard does not allow to maintain planned sales volumes on customer level (MD63). Hence only the aggregation of all demand of each customer can be used as reference for planned volumes (e.g. BF). In addition the SAP standard offers only a call-off analysis on each scheduling agreement (see 1. Scheduling Line above). In the automobile sector it is common that several scheduling agreements being used due to the need of using several unloading Point (GER Abladestellen).
When the Sales & Operation Planning (S&OP) of SAP Integrated Business Planning (IBP) being used the maintenance of planned Sales volumes per customer is possible.
The above half-automated Query – Excel Analysis offers a solution between.